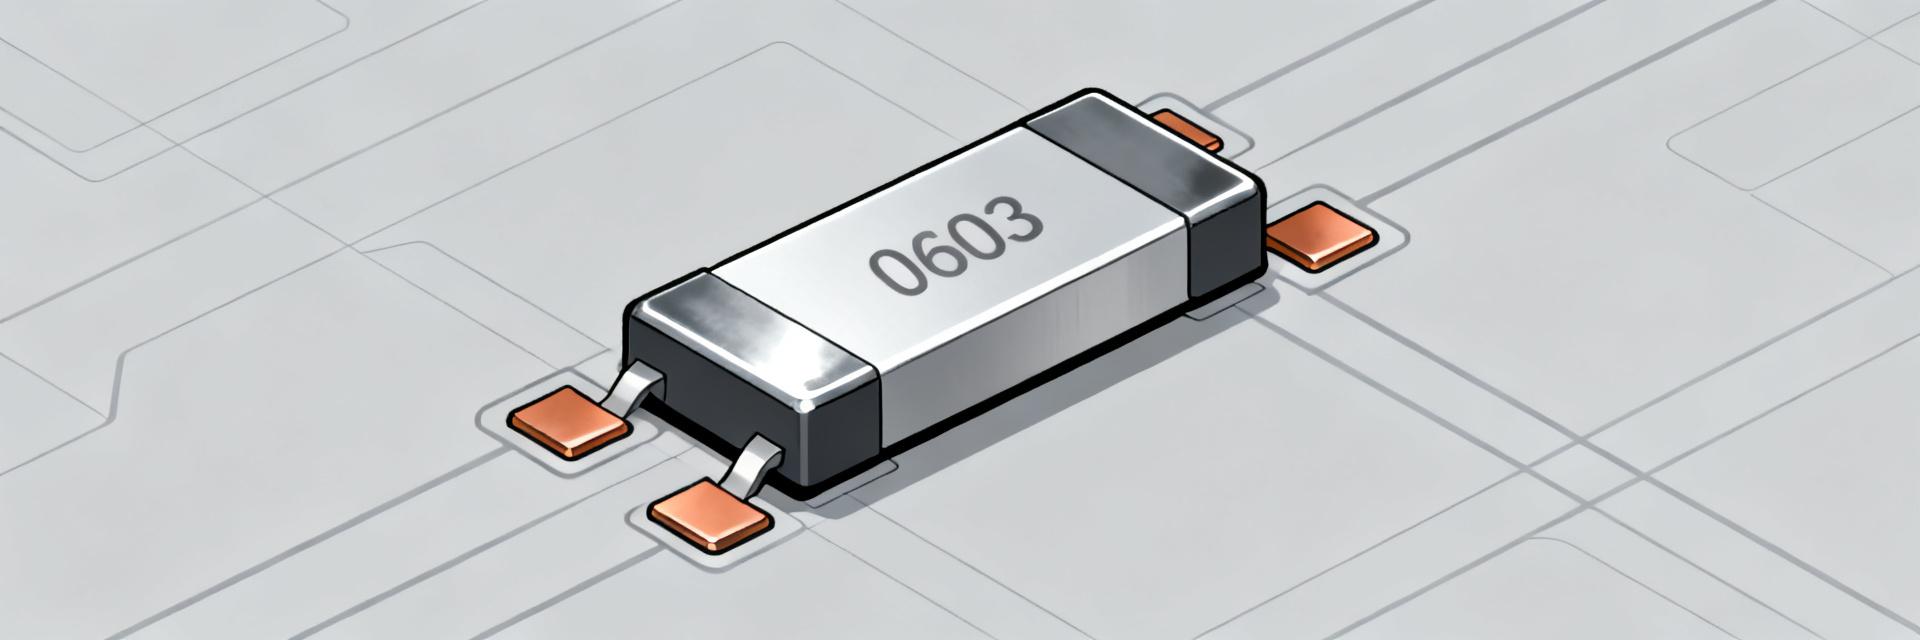
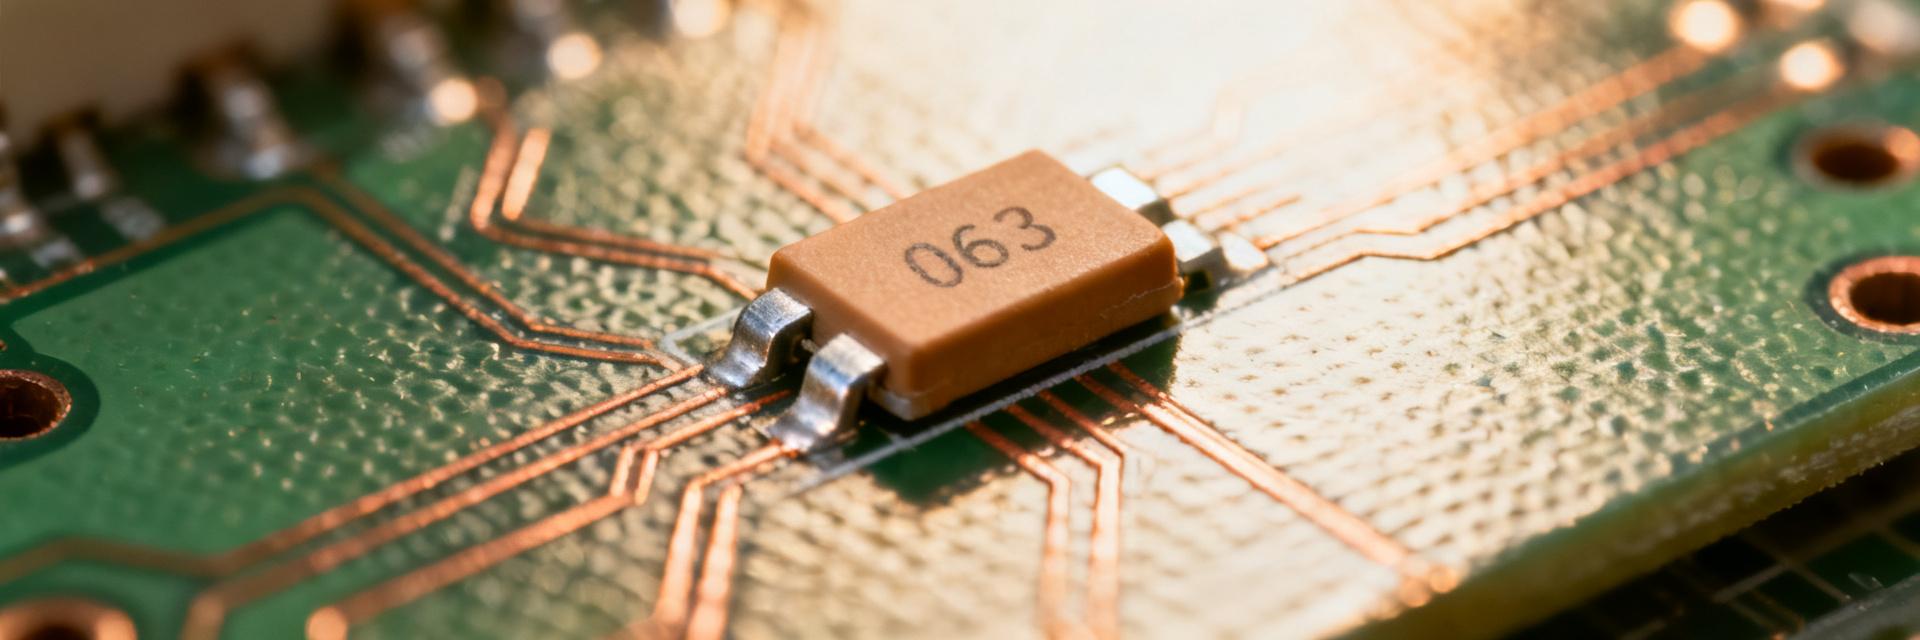
0603 SMD Resistor Performance: Measured Specs & Limits
Bench tests across multiple lots show the 0603 SMD resistor frequently deviates from nominal under thermal and power stress; measured distributions reveal meaningful tails that affect precision designs. This article presents measured performance and specs—initial tolerance distributions, TCR behavior, power-derating, and observed failure thresholds—so engineers can set realistic design margins.
Strategic Focus
Presenting measured metrics, repeatable test methods, and an actionable selection checklist for in-house validation. Includes sample-size notes and equipment recommendations mapping directly to BOM decisions.
Core Highlights
- Tolerance histograms & long-term drift analysis.
- Anti-self-heating techniques for test setups.
- Incoming-part validation plans for production.
Why 0603 SMD resistor specs matter for modern designs

Typical applications and why size drives trade-offs
Point: 0603 parts are ubiquitous in consumer, IoT, and high-density portable designs where board area is premium.
Evidence: Their small footprint enables dense routing but limits thermal mass and copper conduction.
Explanation: Designers must trade space for lower continuous power, higher TCR variability, and wider noise/stability envelopes, especially in precision analog front-ends.
Key spec parameters to watch
Point: Focus on tolerance, TCR, power rating/derating, noise, and failure thresholds.
Evidence: Tolerance sets initial accuracy, while TCR defines temperature-induced error.
Explanation: Published power ratings assume ideal PCB copper; real-world performance depends heavily on layout and thermal path validation.
Measured resistance stability: tolerance, drift & TCR
Bench results: initial tolerance vs. long-term drift
In a mixed-lot sample (n=120, random lots), measured initial spreads vary significantly by technology:
Measured TCR across common 0603 technologies
Power handling, thermal limits & derating curves
Measured power dissipation vs. package temperature rise:
60 mW
100 mW
150 mW
Practical derating rules: Tests show doubling copper area around pads increases allowable continuous power by roughly 1.8×. Apply conservative derating (reduce nominal power by 30–50%) for compact layouts.
How we measured: test methods & reproducibility
Recommended Test Setup
- ✔ Four-wire Kelvin resistance measurement.
- ✔ Low-current excitation to avoid self-heating.
- ✔ Temperature chambers with ±0.5°C control.
Data Quality Standards
- ✔ Sample sizes of n≥60 per lot.
- ✔ Report mean, median, and 95% CI.
- ✔ Flag outliers exceeding 5σ criteria.
Real-world case studies: failure modes & measured limits
Observed Failure Modes
Open Circuits: Occurred after sustained power >3× continuous rating.
Progressive Drift: Triggered by humidity stress or thermal cycling fatigue.
Variant Comparative Limits
Thin-Film: Superior TCR but lower robust overload tolerance.
Thick-Film: Higher noise but better surge tolerance for short bursts.
Engineer's Selection & Validation Checklist
Selection Priority
- Precision: Tolerance ≤0.1%, TCR ≤50 ppm/°C.
- Power: Verified derated power + PCB copper strategy.
- Consumer: 1%–5% tolerance with standard power specs.
In-House Validation
- Sample: n=30–60 parts per incoming reel.
- Stress: 5× power soak at rated power for 1 hour.
- Threshold: Drift must remain
Summary
- Tolerance & Drift: Expect ~20–25% within ±1% and ~80–90% within ±5% out of reel; plan for aging drift in precision designs.
- Thermal Management: Board layout can change allowable power by ~1.8×. Measure delta-T per mW on your specific board.
- Quality Control: Use the provided validation checklist for incoming sample checks and power-soak steps to ensure long-term BOM reliability.