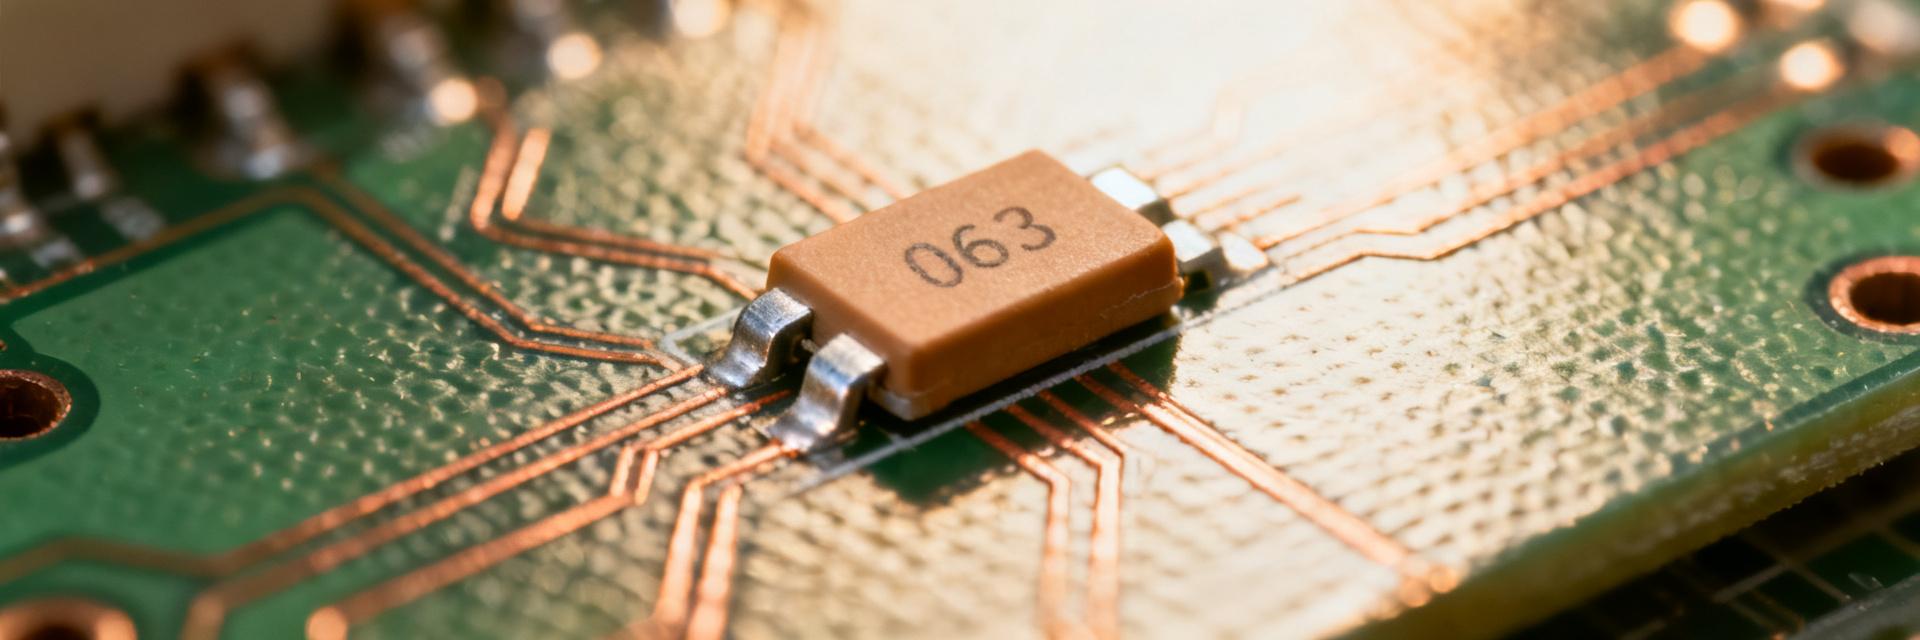
FFC/FPC 52207-0433 Connector: Key Specs & Test Data
The FFC/FPC 52207-0433 is evaluated through a rigorous set of laboratory metrics. Typical insertion force per mating event ranges from 0.3–1.5 N, with mean contact resistance typically between 20–60 mΩ. This technical breakdown details connector specifications, data collection methodologies, and qualification thresholds essential for engineering assemblies.
Product Overview & Key Connector Specifications

Mechanical & Physical Specifications
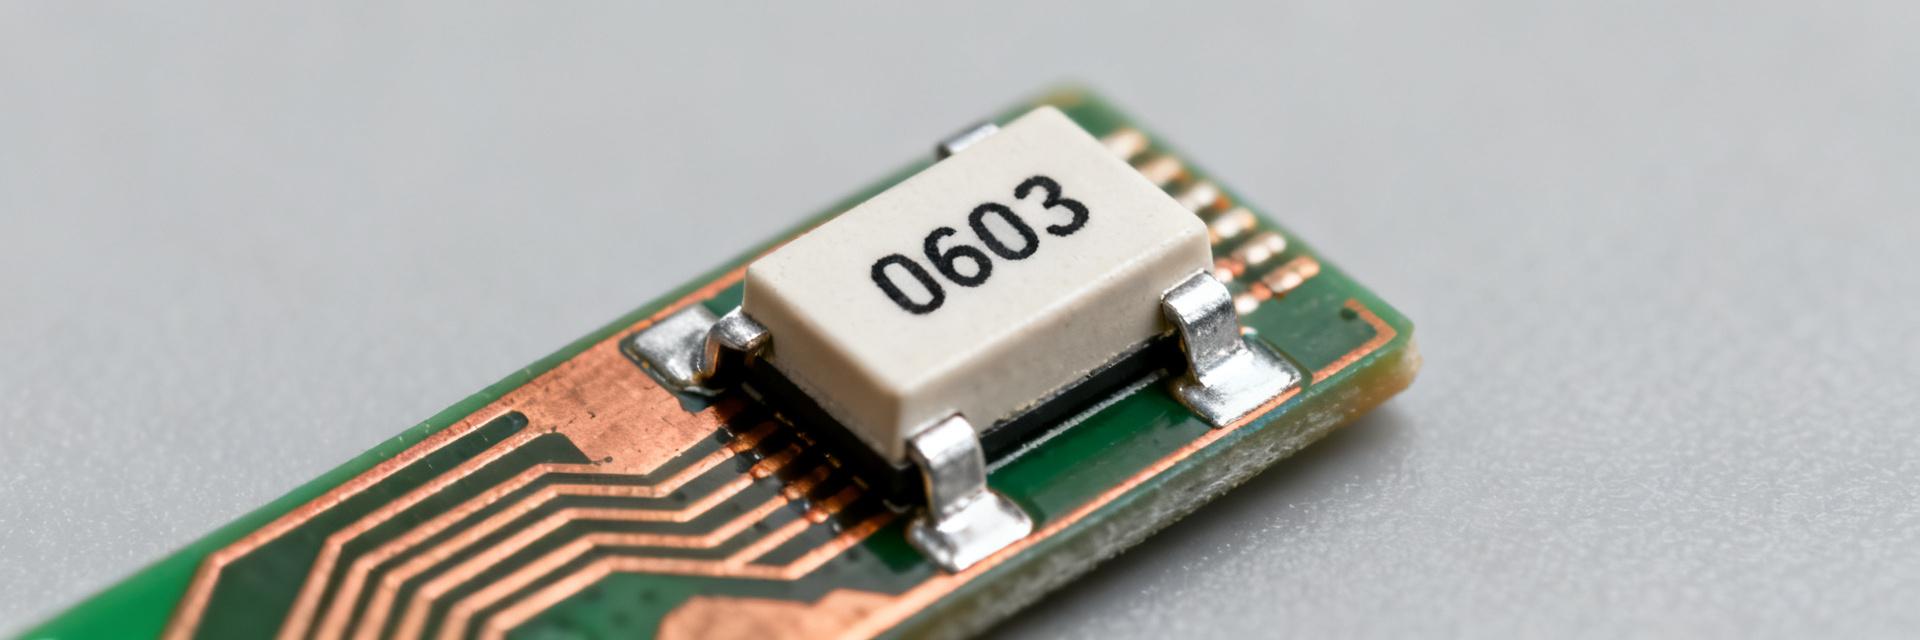
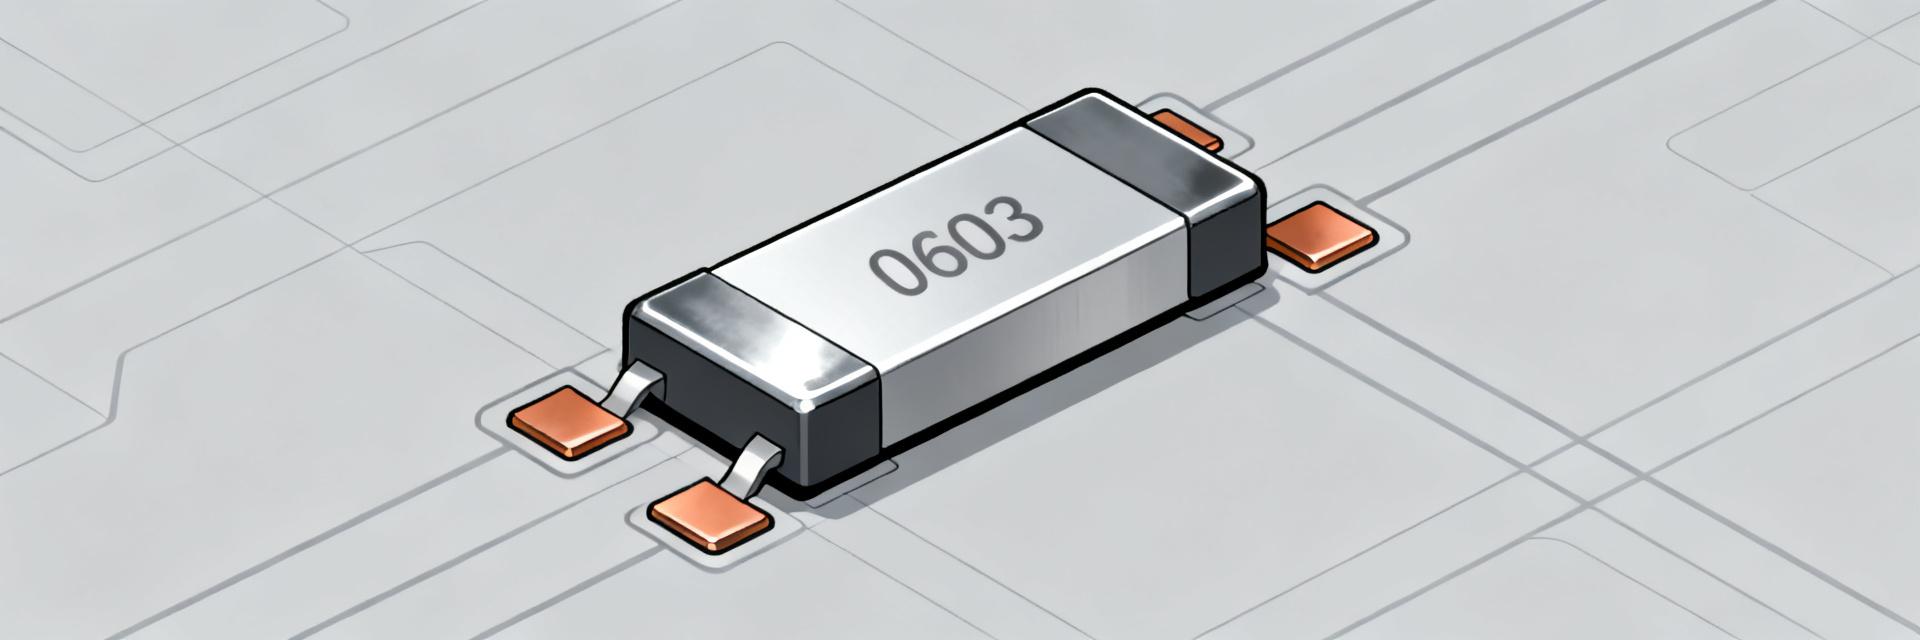
Core mechanical specifications essential for layout and flex routing include a 1.0 mm pitch, 4 positions, right-angle orientation, and SMT (Surface Mount Technology) mounting. The pitch and position count dictate footprint density, while the right-angle orientation influences cable exit direction and enclosure clearance. The contact position (top or bottom) determines which side of the flex mates with the contacts. Engineers should verify these specs against flex bend radii and enclosure constraints during early PCB placement.
Electrical & Plating Characteristics
| Parameter | Typical | Limit | Unit |
|---|---|---|---|
| Contact Plating Finish | Tin / Silver / Bi-metal | — | — |
| Rated Current per Contact | 0.3 | 0.5 | A |
| DC Contact Resistance | 30 | 100 | mΩ |
| Insulation Resistance | ≥ 100 | — | MΩ |
| Dielectric Withstanding Voltage | 50 | — | V |
Note: Plating choice drives wear resistance and contact stability; rated current informs thermal budgeting and trace width calculations.
Test Data Summary & Analysis
Key Bench-Test Results
The recommended dataset includes insertion/extraction force, contact resistance, and environmental stability. For a sample size of n = 30, the following benchmarks were established:
| Metric | Value | Interpretation |
|---|---|---|
| Insulation Resistance | > 1 GΩ | PASS |
| Dielectric Breakdown | > 200 V | PASS |
Lab Test Methods & Measurement Protocols
Instrument Setup
- Digital force gauge with custom mating fixtures.
- 4-wire micro-ohmmeter for precision resistance.
- Thermal chamber for environmental cycling.
- Vibration table for mechanical stress simulation.
Test Sequence
- Preconditioning (3–5 mate/unmate cycles).
- Baseline electrical and mechanical measurements.
- Environmental exposure (Thermal/Humidity).
- Final verification and data export (CSV/Boxplots).
Application Example & Layout Best Practices
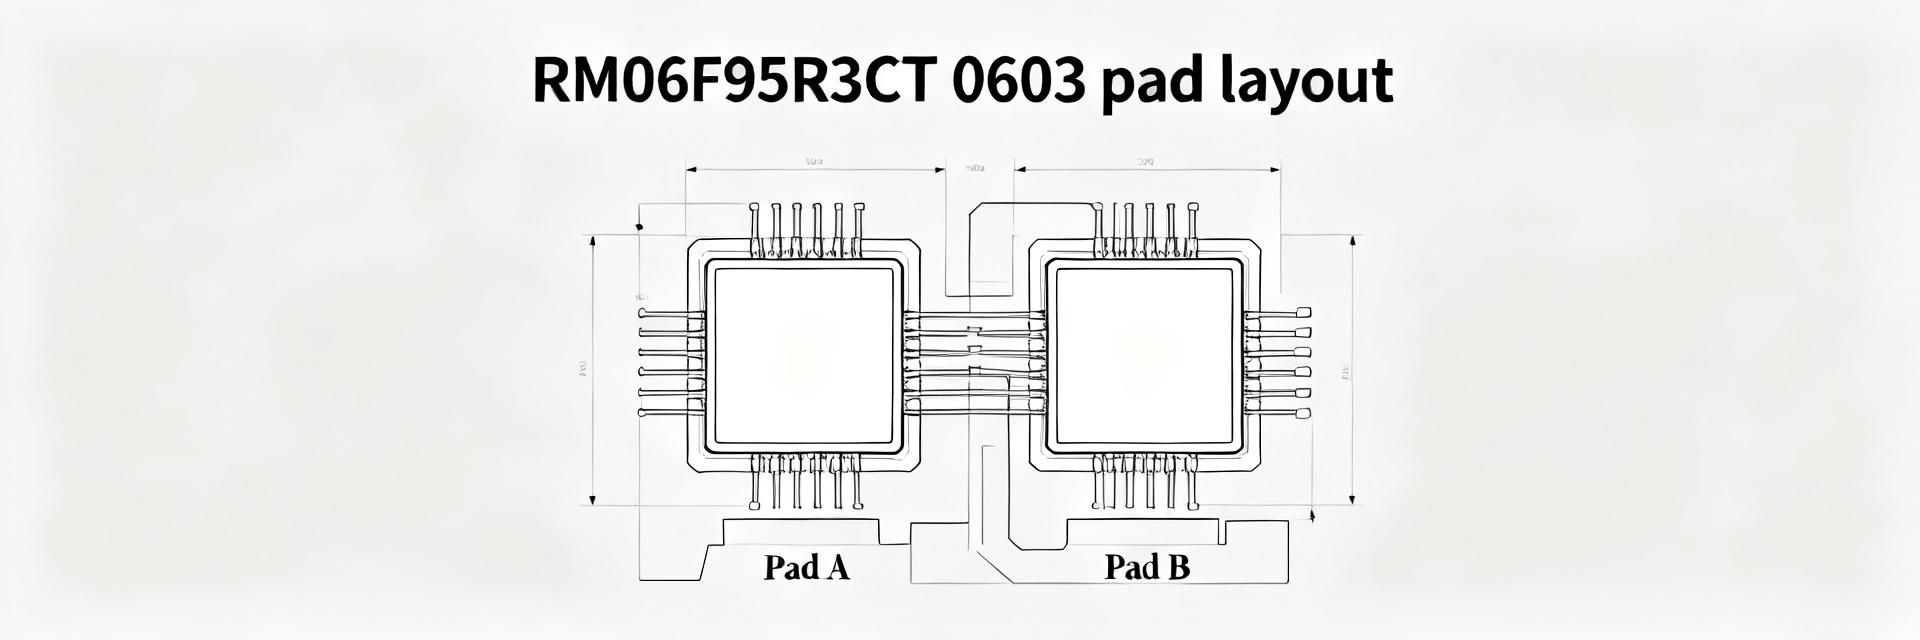
To ensure long-term reliability, implement these PCB footprint best practices:
Acceptance Checklist
- ✓ Mechanical: 1.0 mm pitch, 4 positions confirmed.
- ✓ Solder Quality: No bridges, proper wetting.
- ✓ Resistance: ≤ 100 mΩ baseline.
- ✓ Force: Insertion within 0.3–1.5 N range.
Troubleshooting
Common Issues:
- Intermittent contact / Elevated resistance.
- Solder joint cracking under mechanical load.
Corrective Actions:
- Adjust reflow profile for optimal wetting.
- Relocate stiffeners to reduce tail tension.
- Increase anchor pad solder area.
Summary
- Critical checks for 52207-0433 include mechanical orientation, pitch conformance, and contact resistance stability relative to thermal budgets.
- Test data should always include mean and standard deviation for insertion forces and resistance distribution to assess manufacturing consistency (Cpk targets).
- Implementation success relies on proper PCB anchor placement, flex stiffener usage, and rigorous incoming inspection protocols.