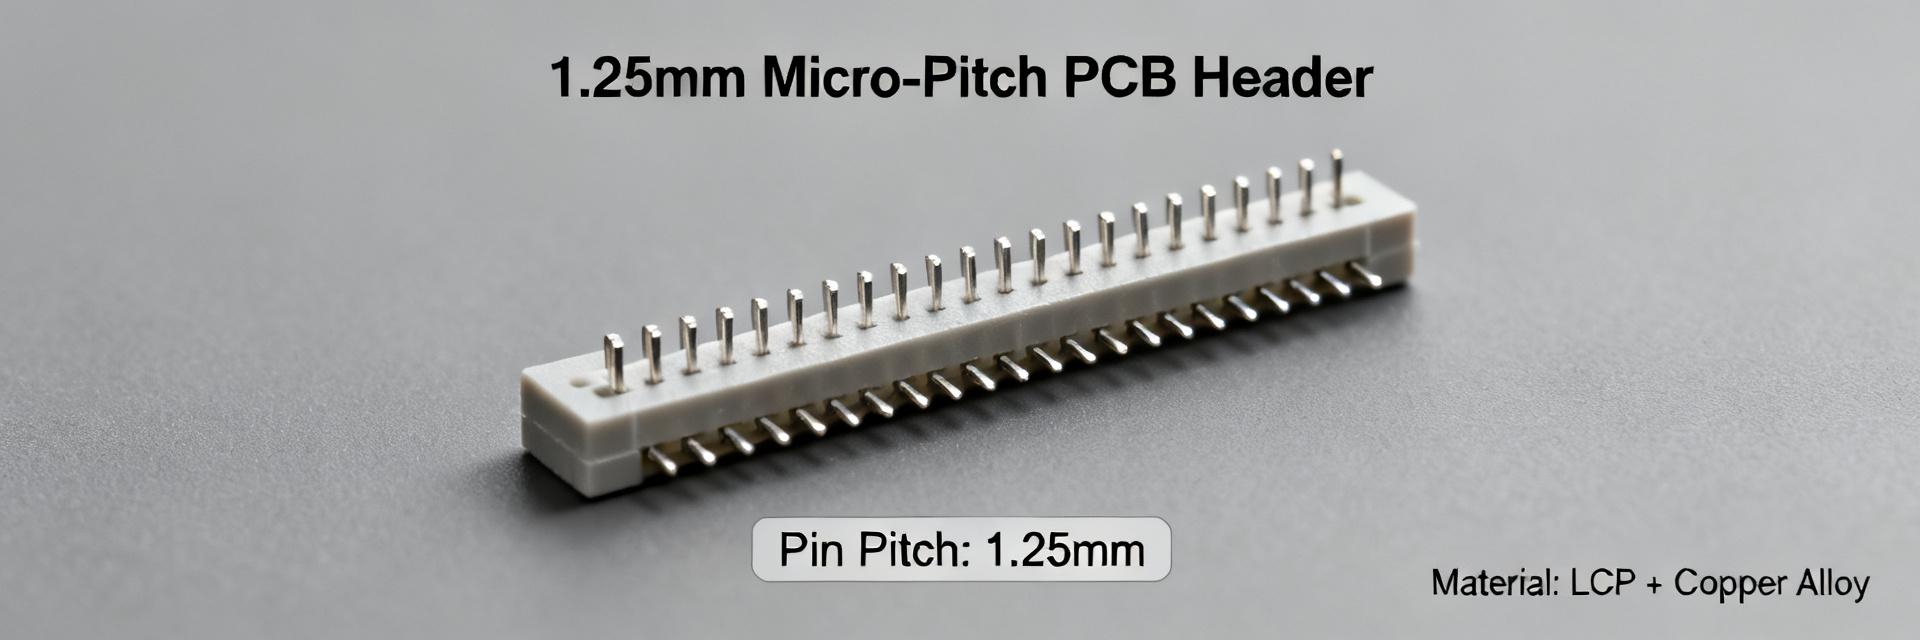
1.25mm micro-pitch header: Latest Adoption Drivers
Recent market indicators show increasing PCB I/O density, shrinking board real estate in wearable and edge devices, and higher channel counts per connector—signals accelerating interest in the 1.25mm micro-pitch header. Aggregated supply and product signals across mobile, wearables, and IoT suggest measurable momentum for tighter-pitch, high-pin-count interconnects.
1 — Market context: Why micro-pitch matters in 2025 (Background introduction)
Point: Adoption is driven by device miniaturization and I/O density demands. Evidence: Product categories—wearables, smartphones, ultra-thin laptops, and edge sensors—are compressing connector real estate while increasing channel counts. Explanation: As PCB area per connector falls, designers favor 1.25mm pitch to pack more pins without increasing board layers or size.
1.1 Market signals and growth vectors
Point: Unit-density and channel-count trends favor micro-miniature connectors. Evidence: Analysts report continued CAGR ranges in FFC/FPC and board-to-board segments; unit density and per-device I/O counts are rising. Explanation: Higher pin counts per mm enable smaller modules and fewer overall assemblies, unlocking slimmer product profiles and lower enclosure volumes.
1.2 Regulatory & standards influences
Point: EMI/EMC and interoperability expectations indirectly shape connector choice. Evidence: Tighter form-factor standards and emissions limits increase emphasis on controlled-impedance routing and connector shielding. Explanation: These constraints push teams toward connectors that support consistent reference planes and predictable SI behavior—factors that influence adoption decisions.
2 — Technical adoption drivers: electrical & signal integrity (Data analysis)
Point: Signal-speed and density requirements make pitch choice critical. Evidence: Designs targeting multi-gigabit links demand differential pair routing density and crosstalk mitigation. Explanation: 1.25mm pitch reduces trace length and interconnect transitions but requires careful impedance control and validated insertion/return loss metrics.
2.1 High-density IO and signal-speed requirements
Point: Designers evaluate measurable SI metrics before adopting micro-pitch. Evidence: Common metrics include controlled impedance tolerance (±10%), insertion loss at target data rate, and near-end/far-end crosstalk levels. Explanation: Validating these metrics via S-parameter captures and PCB stack-aware models prevents late-stage rework.
2.2 Power, thermal, and reliability trade-offs
Point: Micro-pitch impacts current capacity and mechanical lifecycle. Evidence: 1.25mm contacts typically limit continuous current per pin compared with larger pitches; contact resistance and mating-cycle ratings (hundreds to low thousands) vary by design. Explanation: Teams should request supplier specs for contact resistance, max current per pin, and validated mating-cycle lifetimes when assessing suitability.
3 — Manufacturing & assembly drivers: yield, cost, and testability (Data analysis)
Point: Assembly readiness and yield influence cost-benefit of adoption. Evidence: Pick-and-place tolerances tighten, reflow profiles must be tuned, and AOI/X-ray processes often need adjusted criteria. Explanation: Process changes raise initial NPI cost but can be offset by BOM consolidation and routing-layer savings at scale.
3.1 SMT/process readiness and yield impacts
Point: Micro-pitch headers can change common yield metrics. Evidence: Tombstoning sensitivity, solder-void susceptibility, and positional tolerance windows narrow. Explanation: Monitor positional tolerance (±0.1mm), tombstoning rates, and solder joint void percentage during pilot runs to validate process capability.
3.2 Cost-per-pin and volume economics
Point: Per-pin economics shift with volume and PCB-layer trade-offs. Evidence: While raw connector unit cost may be higher, routing density savings and reduced board area lower BOM and enclosure costs. Explanation: Run break-even analysis comparing prototype volumes versus production scale, including PCB layer count, board area savings, and per-pin cost amortization.
4 — Design & integration guide: how engineers adopt 1.25mm micro-pitch headers (Method/guideline)
Point: Layout and mechanical practices mitigate risks. Evidence: Footprint accuracy, keepouts, and reinforcement determine mechanical longevity. Explanation: Following recommended footprints and adding selective mechanical anchors or glue fillets preserves mating reliability in thin assemblies.
4.1 PCB layout and mechanical recommendations
Point: Explicit layout rules reduce integration iterations. Evidence: Recommended keepouts for solder fillets and keepaway from adjacent components, and choices between SMT versus through-hole variants affect stiffness. Explanation: Verify footprint CAD, add mechanical vias or standoffs where mating cycles exceed connector rating.
4.2 Signal routing & EMI mitigation patterns
Point: Routing and reference-plane planning preserve SI and EMI performance. Evidence: Differential pair spacing, controlled impedance traces, and decoupling near power pins reduce emissions and crosstalk. Explanation: Validate with IBIS‑AMI or full-wave simulation, then bench test with channel eye and return-loss sweeps.
5 — Supply chain & sourcing: procurement and qualification considerations (Method/guideline)
Point: Qualification and lead-time realities affect adoption pace. Evidence: Micro-pitch parts often have constrained production lines and longer lead times. Explanation: Include alternate footprints and vendor diversity in RFQs to mitigate single-source risk.
5.1 Supplier qualification and long-lead risk management
Point: Procurement must require process capability evidence. Evidence: Qualifiers include lot traceability, Cpk for critical dimensions, and published test data. Explanation: Demand capability metrics and maintain second-source options and alternate footprints for risk reduction.
5.2 Test & qualification protocols buyers should demand
Point: Buyers should insist on electrical and mechanical test reports. Evidence: Required tests include contact resistance over cycles, thermal cycling, vibration, and solderability. Explanation: Specify sample sizes, acceptance criteria, and retest intervals in qualification documents.
6 — Representative applications & mini case sketches (Case showcase)
Point: Practical examples show where micro-pitch yields clear benefits. Evidence: Consumer camera modules and stacked wearable sensor boards reduce enclosure thickness while increasing I/O. Explanation: Present simple metrics—pins consolidated, mm² saved—to justify design changes.
6.1 Consumer and wearable examples (compact, high-IO designs)
Point: Space-constrained devices benefit most. Evidence: Compact camera stacks and sensor modules often reduce overall stack height by several millimeters when switching to micro-pitch. Explanation: Quantify saved board area and simplified cable routing when presenting to product teams.
6.2 Industrial/edge and automotive use-cases (ruggedization and density)
Point: Rugged use cases demand trade-offs. Evidence: Environmental requirements (vibration, temperature) may favor larger pitches or reinforced micro-pitch variants. Explanation: Evaluate environmental qualification test results and consider reinforced housings for harsh applications.
7 — Action checklist: how to evaluate and adopt 1.25mm micro-pitch header (Action recommendations)
7.1 Quick evaluation checklist for engineers
Point: Engineers need a concise verification list. Evidence: Verify electrical specs, mechanical spec, assembly constraints, insertion loss, contact resistance, and alternate designs. Explanation: Use an 8–12 point checklist during NPI to validate that the connector meets SI, thermal, and mechanical targets before pilot builds.
7.2 Procurement & rollout playbook for product teams
Point: Procurement should manage phased adoption. Evidence: Include in RFQ: part-level test reports, sample qualification, and explicit acceptance criteria; track KPIs such as yield and time-to-mate failures. Explanation: Include "1.25mm micro-pitch header" explicitly in procurement documentation to ensure vendor bids align with expectations.
| Pitch | Typical pins/mm | Common trade-off |
|---|---|---|
| 2.54mm | Low | Robust, larger area |
| 1.25mm | High | Higher density, tighter assembly controls |
| 0.8mm | Very high | Significant SI/assembly constraints |
Summary
Conclusion: Measurable technical, manufacturing, and market drivers are converging to accelerate adoption of the 1.25mm micro-pitch header across multiple segments. Teams should run focused validation and cost-per-pin analysis before large-scale transition. Call-to-action: Adopt the checklist, validate SI and assembly metrics, and quantify trade-offs during pilot runs.
- Design verification: Validate insertion/return loss, controlled impedance, and crosstalk before committing to production; these determine successful adoption and SI risk mitigation.
- Manufacturing readiness: Monitor positional tolerance and tombstoning, adjust AOI/X-ray criteria, and confirm reflow profiles to protect yield and lower per-unit cost.
- Procurement playbook: Require supplier capability reports, define acceptance criteria, and maintain alternate footprints to manage lead-time and supply risk.
Frequently Asked Questions
What performance metrics should be prioritized when evaluating 1.25mm micro-pitch header adoption?
Prioritize controlled impedance tolerance (±10%), insertion loss and return loss at target data speeds, differential crosstalk figures, contact resistance, and validated mating-cycle lifetime. Request S-parameter data, thermal derating, and solderability reports during RFQ to quantify risk early.
How does adopting a 1.25mm micro-pitch header affect PCB assembly yield?
Micro-pitch headers tighten positional tolerances and increase sensitivity to tombstoning and voiding. Expect initial NPI yield impacts; mitigate by tuning pick-and-place accuracy, reflow profile optimization, and updating AOI/X-ray acceptance rules. Pilot runs reveal process capability before scale.
When is it not advisable to switch to 1.25mm micro-pitch headers?
Avoid switching if environmental ruggedness (frequent high-vibration or extreme-temperature duty) or high continuous current per pin is mandatory and no reinforced variants are available. Also defer if supplier lead times or lack of second sources present unacceptable production risk.